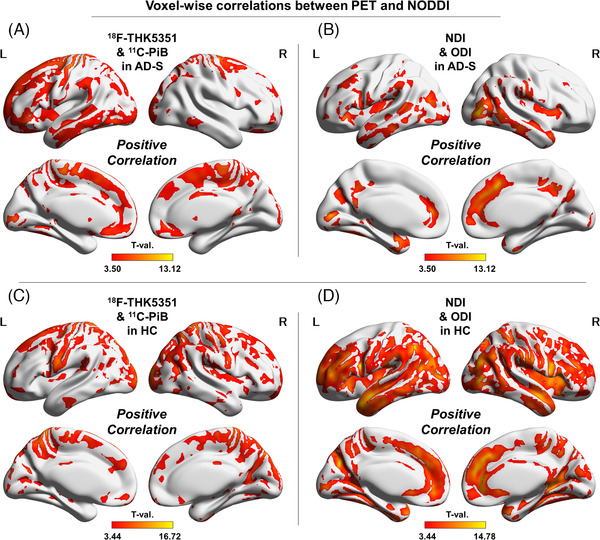
FIGURE 3.

Voxel‐wise correlations between PET and NODDI. (A) Positive correlations between 18F‐THK5351 and 11C‐PiB in the AD‐S group, (B) positive correlations between the NDI and ODI in the AD‐S group, (C) positive correlations between 18F‐THK5351 and 11C‐PiB in the HC group, and (D) positive correlations between the NDI and ODI in the HC group. Color bars denote the statistically significant T‐values from minimum to maximum
