FIGURE 5.

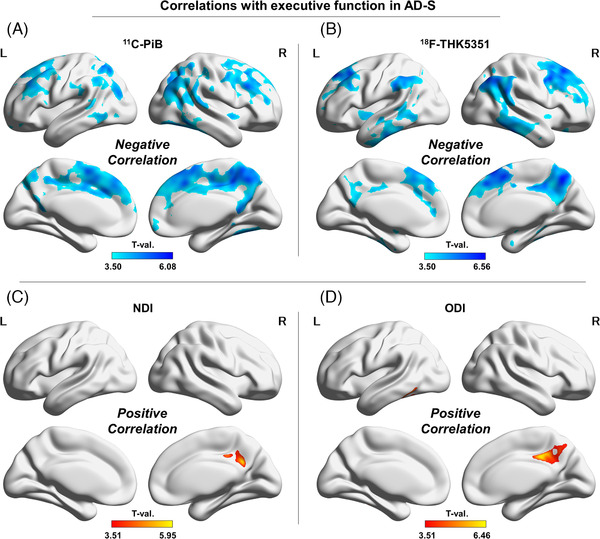
Correlations with executive function in the AD‐S group. (A) 11C‐PiB, (B) 18F‐THK5351, (C) the NDI, and (D) the ODI. Color bars denote the statistically significant T‐values from minimum to maximum

Correlations with executive function in the AD‐S group. (A) 11C‐PiB, (B) 18F‐THK5351, (C) the NDI, and (D) the ODI. Color bars denote the statistically significant T‐values from minimum to maximum