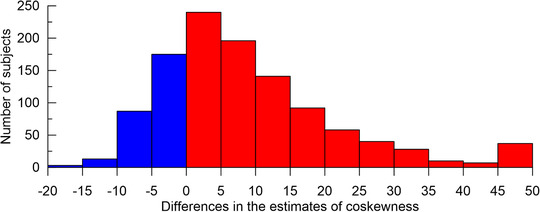
FIGURE 3.

Differences in the estimates of co‐skewness using haplotype‐ and genotype‐based methods. The histogram shows the differences between the estimates of the differences in co‐skewness in cases and non‐cases multiplied by 103, that is, . Red (blue) denotes negative (positive) differences. Red shows dominant skewness driven by deviation from the Hardy‐Weinberg equilibrium at the haplotype level in the AD‐affected subjects. The differences in magnitude, which are larger than the x‐axis limits, are included in the flanking bins
