Fig. 1.
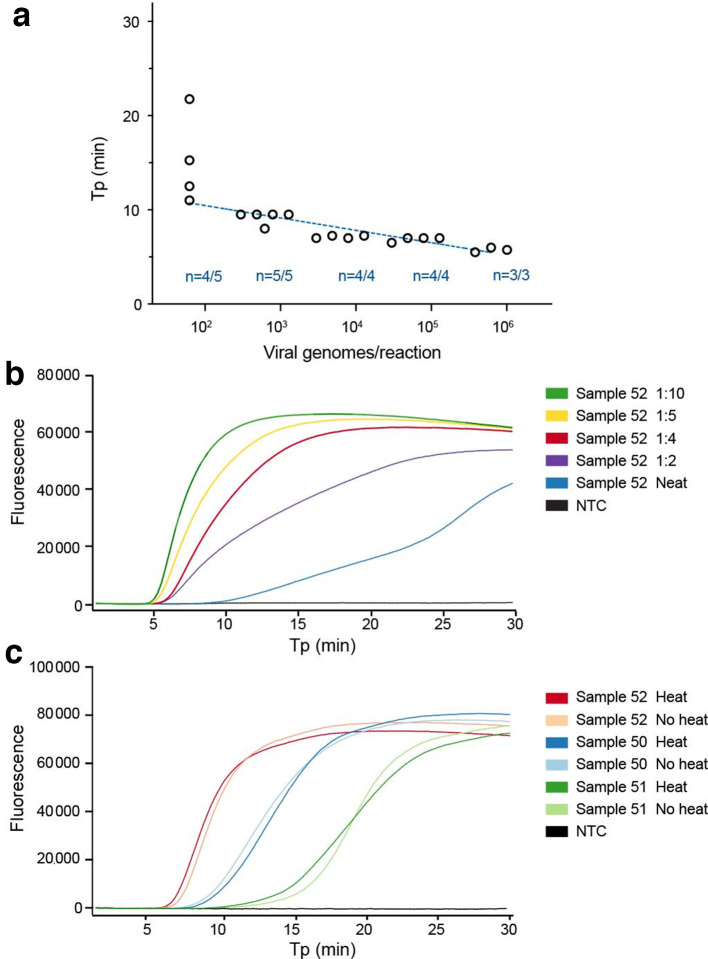
Limit of detection of N1-STOP-LAMP and establishing optimal sample template volume and inactivation conditions. (a) Plot showing performance of the N1 LAMP assay across 5-log10 dilution of purified viral RNA. Y-axis is time-to-positive (Tp) and the x-axis is an estimate of viral genomes/reaction based on starting RNA concentration. The number of replicates per dilution (n) and number of positive replicates per dilution is indicated. (b) Example N1-STOP-LAMP amplification plots for SARS-CoV-2 positive clinical sample No. 52, showing inhibitory impact of 5 µl of a neat sample matrix on LAMP and the effect of diluting the UTM in water. (c) N1-STOP-LAMP amplification plots for three SARS-CoV-2 positive clinical samples, showing no loss in detection sensitivity after specimen heat-treatment of 60 °C for 30 min to inactivate virus.

