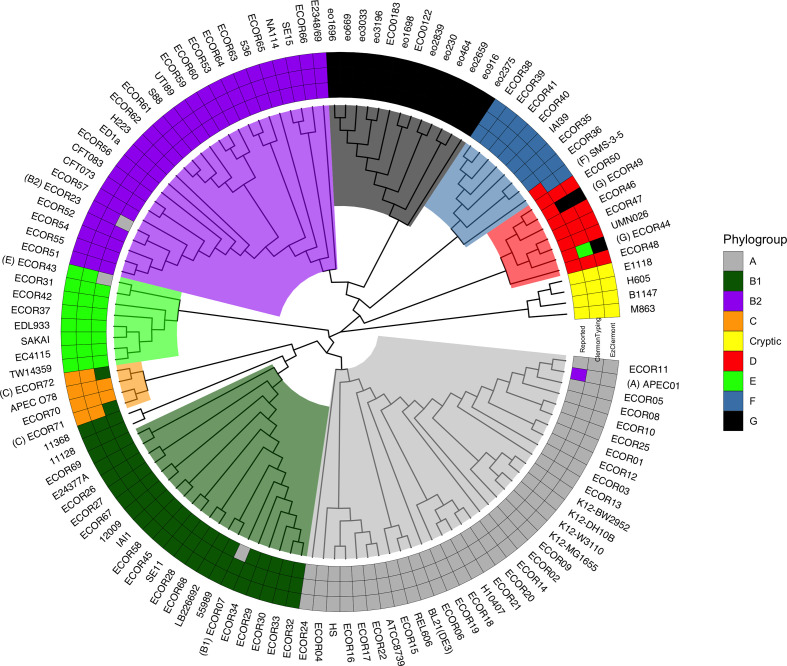
Fig. 1.
Cladogram of whole-genome phylogeny for members of the ECOR collection and phylogroup G isolates from the work by Clermont and colleagues [5]. Clades are background-coloured by dominant phylogroup. The heatmap surrounding the tree shows phylogroups determined from: literature (inner ring), ClermonTyping (middle ring) and EzClermont (outer ring). The literature phylogroup was not supported by in silico analysis for seven strains. Both EzClermont and ClermonTyping agree with the phylogenetic lineage in all but two cases: ECOR44 and ECOR49.

