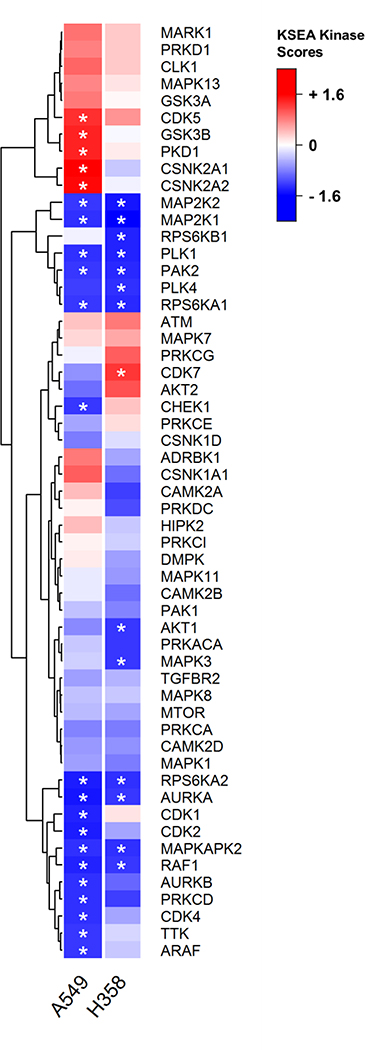
Figure 3.
KSEA calculations identified common downregulation of select MAPK proteins but a high proportion of cell cycle kinases in A549.
Heat map reporting KSEA results according to the normalized scores. Only kinases that are shared between the two datasets and that have 5+ substrates are included. Asterisks indicate the scores meeting the p < 0.05 statistical cutoff. Blue color represents negative kinase scores, and red represents positive.

