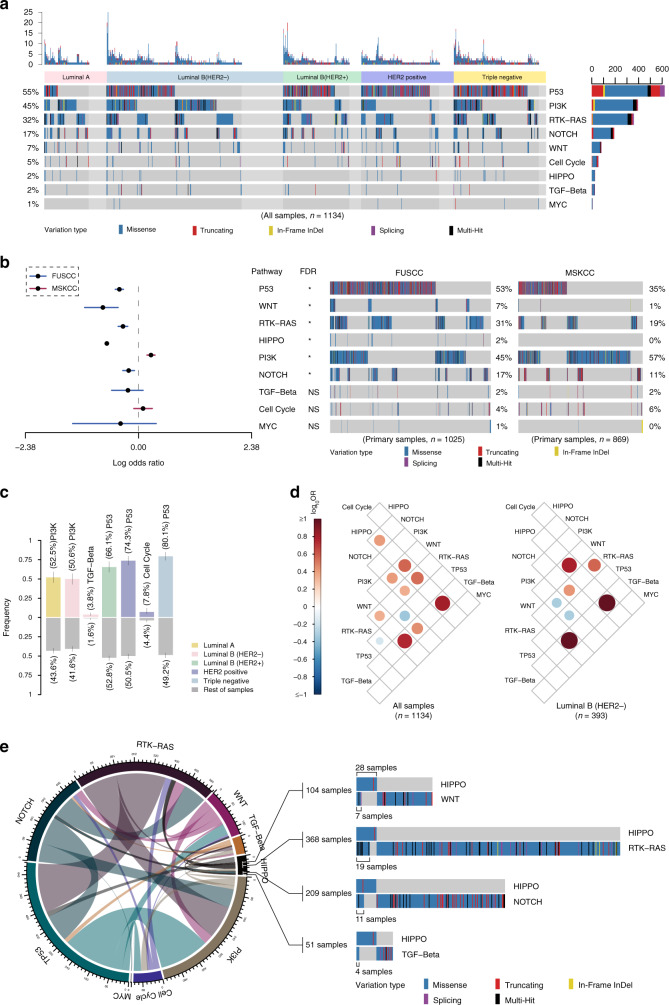
Fig. 4. Characteristics of mutations in oncogenic signaling pathways in prospectively sequenced Chinese breast cancer.
a Landscape of pathway mutations in 1134 Chinese breast cancer samples classified by the molecular subtype and annotated with the variation type. The mutation counts in each sample and each pathway are provided above and on the right side, respectively. b Comparison of mutations in oncogenic signaling pathways in primary samples between our cohort and the MSKCC dataset. The middle circular spot corresponds to a value for odds ratio and the lines represent 95% confidence intervals. A red or blue horizontal line represents the significant or non-significant result of the comparison of mutation frequencies between our cohort and the MSKCC’s cohort in each signaling pathway, respectively. The red line indicates a higher mutation frequency in the corresponding pathway favors in the MSKCC’s cohort, while the blue line indicates a higher mutation frequency in the corresponding pathway favors in our cohort. A total of 1025 primary breast cancer samples from FUSCC are compared with 869 primary breast cancer samples from MSKCC by different mutation status in oncogenic signaling pathways using Fisher’s exact test, adjusted by false discovery rate (FDR). The asterisks indicate FDR < 0.05. c Significant enrichment of pathway mutations in different molecular subtypes of breast cancer. d Significant mutual exclusivity (blue) and co-occurrence (red) of gene mutations in pathways in Chinese breast cancer (all samples, right; luminal B/HER2−, left). Spectrum bar: log10 (odds ratio (OR)); the color intensity represents the scale of the value. e Circus plot displaying the co-occurrent patterns among the oncogenic signaling pathways in our cohort. The line thickness corresponds to the number of mutations in two co-occurrent pathways. The significant co-occurrent patterns of mutations in the Hippo pathways are illustrated. Source data for b are provided as a source data file.

