Figure 2.
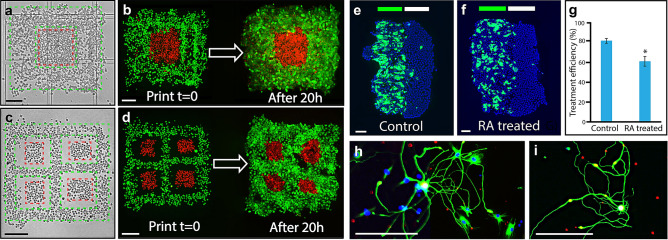
Post-printing model development and cell growth. (a–d) present experimental examples of an oncology model, highlighting before and after a 20 h incubation. A simple encapsulated islet of skin cancer cells (A431) surrounded by, and in contact with, an epithelial cell layer (HaCaT) is shown in (a,b) whereby HaCaT and A431 cells were labelled with cytotracker-green (green dashed boundary) and cytotracker-red (red dashed boundary), respectively prior to printing. A brightfield image of the pattern directly after printing is shown in (a), where dashed lines indicate the boundaries of the printed cell types. The corresponding fluorescent image is shown on the left of panel (b), whereby the grown oncology model is presented to the right of panel (b). A more complex version of this encapsulation model is presented in (c,d) whereby four skin cancer cell islets (A431), are printed and surrounded by an epithelial cell layer (HaCaT). The two cell types were printed to not be in contact, to allow each cell type to attach to the surface and grow prior to interacting with each other. (c,d) were performed using the same timing and conditions as for (a,b). (e,f) present examples of the basic skin model, composed of a two-printed stripe structure of differentiated and non-differentiated HaCaT cells expressing different levels of CK10. (e) presents a control tissue and (f) presents tissue treated with all trans retinoic acid (RA). The green and white bands at the top of the panels indicate the approximate printed stripe width of differentiated and non-differentiated cells, respectively. A summary plot of the RA treatment is shown in (g), presenting the mean values of CK10 expression for both the controls (81.8%, n = 10) and the treated samples (61.4%, n = 16), demonstrating a statistically significant reduction of approximately 25% in CK10 expression. Error bars represent standard error. (h,i) Show acutely isolated primary rat dorsal root ganglia (DRG) neurons, which were patterned and allowed to form processes. Post printing, the sample was allowed to mature and grow for 9 days in standard neuronal culture conditions, where network establishment could be monitored. The scale bar in all panels represents 200 µm.

