Figure 3.
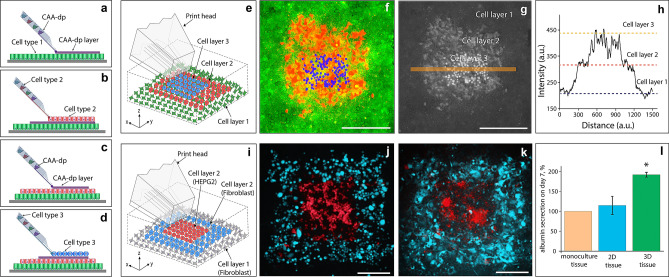
Direct 3D cell bioprinting (a–d) is an overview of the 3D printing process, whereby a substrate is pre-cultured with a confluent cell layer, upon which a layer of cell attachment agent (CAA-dp) can then be deposited (a). Directly after CAA-dp deposition, a second layer of cells can then be printed (b) and incubated for 24 h. This process of depositing CAA-dp, followed by printing cells and incubating, can be cycled to establish additional layers (c,d), resulting in a 3D patterned structure (e). (f–h) represent a 3D patterned structure, where the base cell layer was composed of A431 cells (green), the middle layer being HaCaT cells (red), and the top layer being A431 cells (blue). A fluorescence overlay of the three colour channels is shown in (f). As a visualisation aid, each channel was normalised to an 8-bit greyscale image, then summed together as a 32-bit image, to readily establish where cells are layered on top of each other (g). A line profile was taken through (g), corresponding to the orange line, to generate the plot (h), indicating the heights after image reconstruction. The construction of a 3D liver cancer model is highlighted in (i–l). A schematic illustration of the model unit is shown in (i). (j,k) present fluorescence microscopy images of the second cell layer of the model unit, consisting of Hep G2 (red) and 3T3-J2 (blue) cells, images are taken at t = 0 (j) and 24 h after printing (k). As a measure of model function we compared albumin secretion among printed monoculture, 2D, and 3D tissues. Three sets of tissues (n = 3) were generated, the details of which are described in S4. The concentration levels of albumin in each set, were adjusted by subtracting the albumin concentration in the fibroblasts sample (background signal), and were normalized against albumin concentrations of monoculture tissues. Albumin production data for each model is shown as a comparison chart in (l). Albumin production for the 3D-printed tissues was found to be significantly higher (Student’s t-test, p-value 0.03, 95% CI) in comparison to the printed 2D tissues. Error bars represent the standard error. The scale bars in all pannels represent 300 µm.

