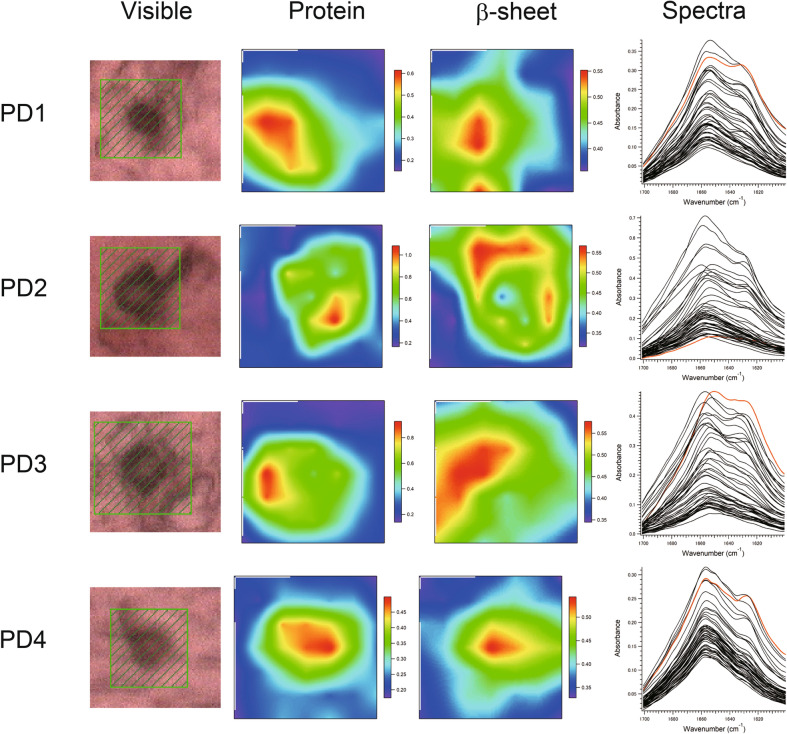
Figure 1.
Visible and FTIR images of LBs in the medullary dorsal vagal nucleus derived from the PD patients (PD1-4, PD2-1, PD3-2, and PD4-1). Shown from left to right are the microscopy images, the amounts of total protein, the proportions of the β-sheet structure, and the spectra at all points in the scan. The colour bar indicates low (blue) to high (red) contents. The area shaded in green in the visible image was scanned with 3 µm steps. 7 × 7 points = 21 × 21 µm2. The red solid line in the spectra shows the FTIR spectrum of the β-sheet richest point.

