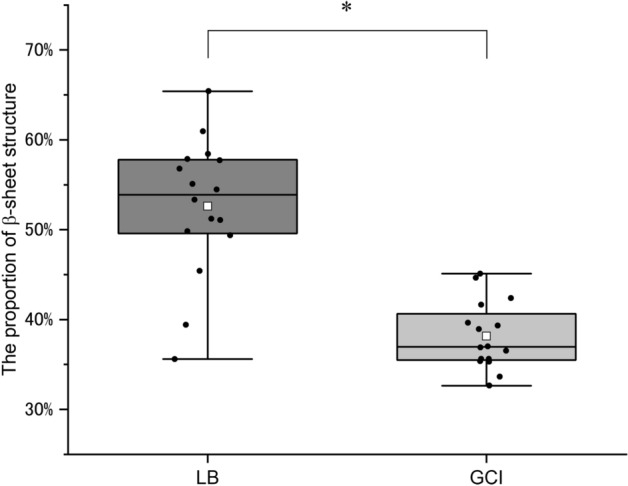
Figure 4.

Proportion of β-sheet structures between LBs and GCIs. The white boxes represent mean values, lines represent median values, and the tops and bottoms of the boxes represent the upper and lower limits of the first and third quartiles, respectively. The ends of the whiskers represent maximum and minimum data points. Black dots are individual analysis values. The proportions of the β-sheet structure in LBs and GCIs are 52.6 ± 1.9% (n = 16) and 38.1 ± 0.9% (n = 16) (mean ± the standard error of the mean), respectively. The median values are 53.9% and 37.0%, respectively. Asterisks above the boxes indicate significant differences determined by Student’s t-test (*P < 0.001).
