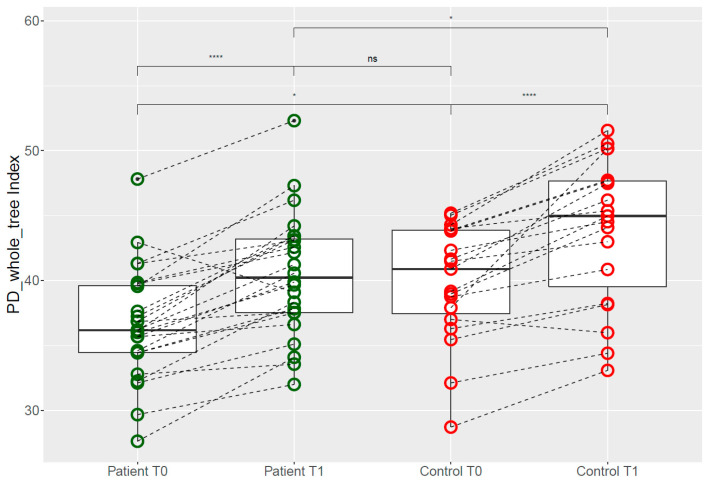
Figure 4.
Alpha diversity change of controls and patients before (T0) and after (T1) short-term oral isoflavone intervention. Both the differences of patients (** p = 0.005) and controls (* p = 0.02) between T0 and T1 were significant using Student’s t-tests. There was a significant difference in diversity between controls and PCOS patients in both T0 (* p = 0.023) and T1 (* p = 0.035). However, there was no difference between controls at baseline (T0) and patients after the intervention (T1, ns, p = 0.669). ns p > 0.05, * p < 0.05; ** p < 0.01; *** p < 0.001.

