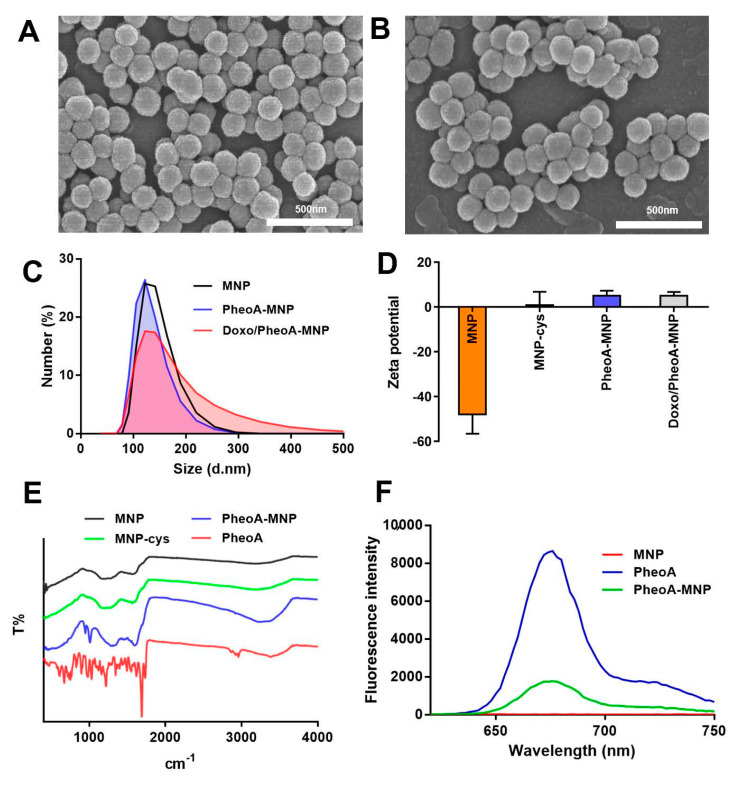
Figure 1.
Scanning electron microscopy (SEM) images of (A) MNPs and (B) PheoA-MNPs (scale bar = 500 nm). (C) Size distribution of MNP (black), PheoA-MNP (blue) and Doxo/PheoA-MNP (red) determined by by dynamic light scattering (DLS). (D) Zeta potential of nanoparticles. (E) FT-IR spectra of MNP (black), MNP-cystamine (green), PheoA-MNP (blue) and free PheoA (red). (F) The fluorescence emission spectra of MNP (red), PheoA-MNP (green), and free PheoA (blue).

