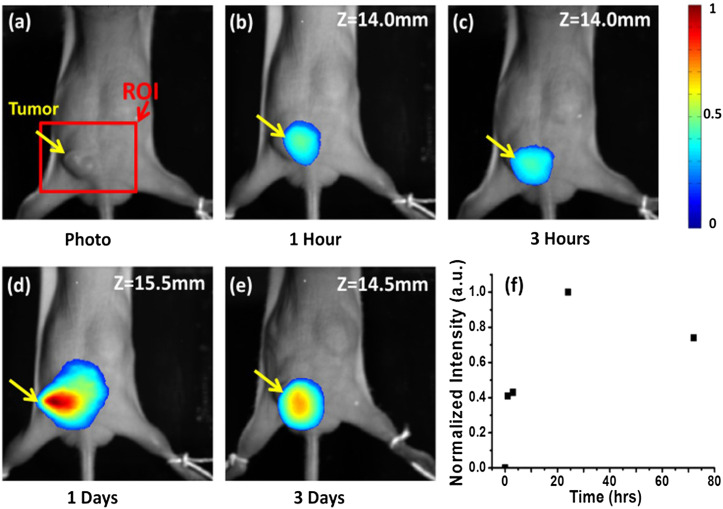
FIG. 8.
(a) Photo of the mouse showing where the tumor was. The mouse was placed within the chamber before it was filled with the matching liquid. [(b)-(e)] Reconstructed 2D fluorescence image of the tumor at time points of 0, 1, 3, 24, and 72 h, respectively, after tail vein injection of antibody-conjugated polymeric ICG micelles. The image plane was along the coronal plane going through the center of the tumor, and the fluorescence image was superposed on the photograph shown in (a). The color scale bar represents normalized fluorophore concentration with 1 as the maximum concentration. (f) Normalized maximum intensity obtained from fluorescence tomography in the tumor area versus the time post ICG-micelle injection, revealing that the maximum fluorescence imaging contrast of antibody-conjugated ICG-micelles was around 1 day after tail vein injection and remained strong even over a period of 3 days.

