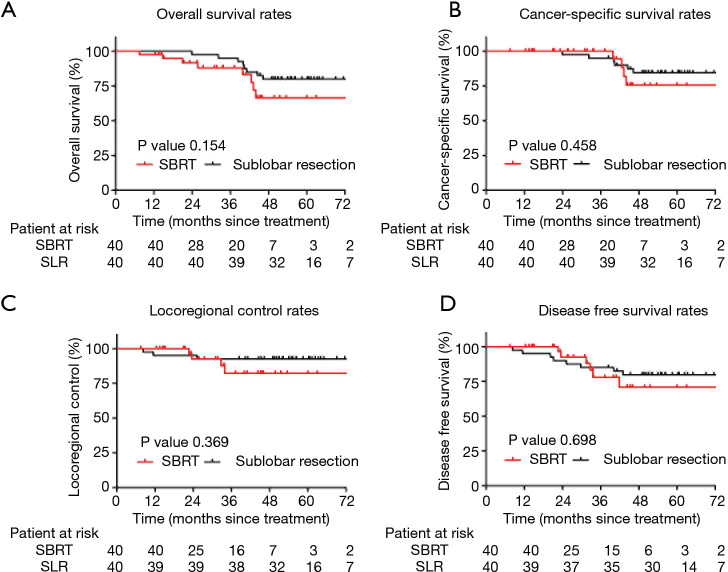
Figure 3.
Kaplan-Meier survival curves of the SBRT and SLR groups after PSM. (A) OS rate, (B) CCS rate, (C) LCR rate, (D) DFS rate. SBRT, stereotactic body radiotherapy; SLR, sublobar resection; PSM, propensity score matching; OS, overall survival; CCS, cancer-specific survival; LCR, locoregional control rates; DFS, disease-free survival.

