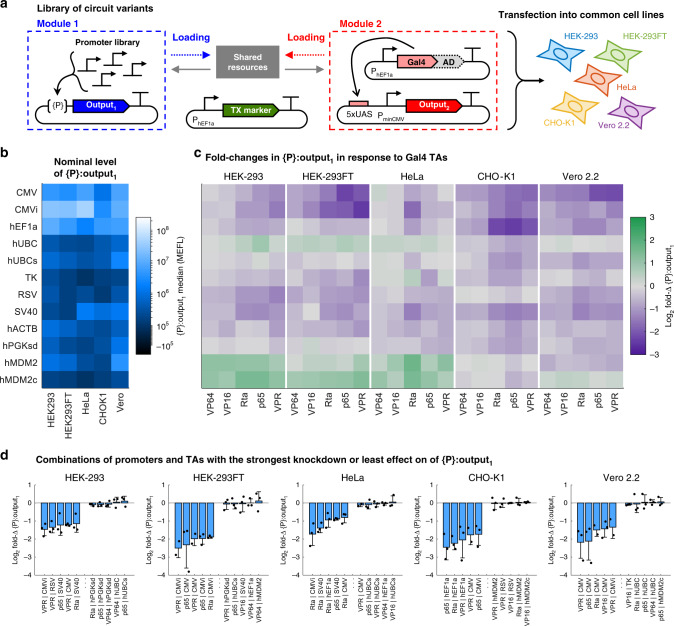
Fig. 2. Effect of resource competition between promoters and activators across cell lines.
a Genetic model system to study competition for resources between different combinations of constitutive promoters ({P}:ouptut1, mKO2) and Gal4 TAs driving a second output (UAS:output2, TagBFP) in different cell lines. The specific promoters, ADs fused to Gal4, and cell lines are shown alongside the data in panels (b, c). A description of each constitutive promoter is provided in Supplementary Table 1. The TX marker is mNeonGreen. b Nominal outputs are the median expression levels of each promoter in Module 1 in each cell line when co-transfected with Gal4-None (i.e., the Gal4 DNA-binding domain), which does not load resources (Supplementary Figs. 1 and 4). c Fold changes (fold-Δs) in the level of {P}:output1 in response to Gal4 TAs. The fold-Δs are computed by dividing the median level of {P}:output1 for each constitutive promoter when co-transfected with different Gal4 TAs, by the nominal output of the promoter in the same cell line. d The five promoter–activator combinations in each cell line with the smallest effect or largest negative effect on the level of output1. Error bars represent the mean ± s.d. of measurements from three experimental repeats (which are represented by the individual points). All data were measured by flow cytometry at 48 h post transfection in the cell lines indicated. Panels (b, c) show the mean of measurements from three experimental repeats. All measurements were made on cells gated positive for TX marker or {P}:output1. Median values for each reporter in each sample are shown in Supplementary Fig. 11 and provided in Source Data.

