
Figure 2.
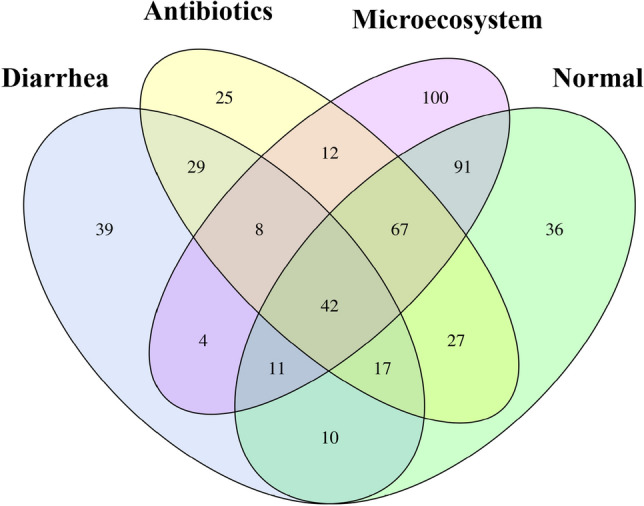
Venn diagram of shared OTUs across different piglet groups in relation with ill-diarrhea and curing. Different colors represent different groups: (1) normal, (2) ill-diarrhea, (3) antibiotics and (4) microecosystem. The interior of each circle symbolically represents the number of observed OTUs in each sample or group. The overlapping area or intersection represents the set of OTUs commonly present in the counterpart samples or groups (diarrhea/antibiotics; microecosystem/normal). The single-layer zone represents the number of OTUs uniquely found in specific sample/group (VenDiagram, R(v3.1.1), BGI Co., Ltd).