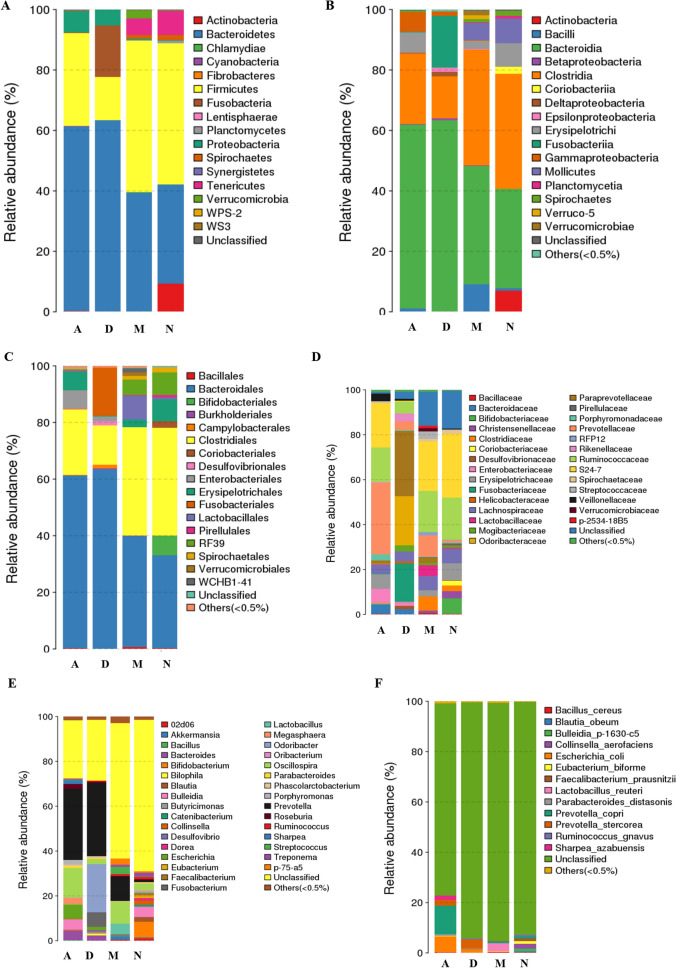
Figure 3.
Taxonomic composition distribution in piglet samples related to ill-diarrhea and curing at phylum, order, class, family, genus and species level. (A) Phylum-level. (B) Class-level, (C) Order-level, (D) Family-level, (E) Genus-level and (F) Species-level. The ratio of each species in a specific sample is directly displayed (color code). At phylum-level, all species were used to draw the histogram. The species of which abundance is less than 0.5% in all samples were classified into “others” in other ranks (ade4, R(v3.1.1), BGI Co., Ltd).

