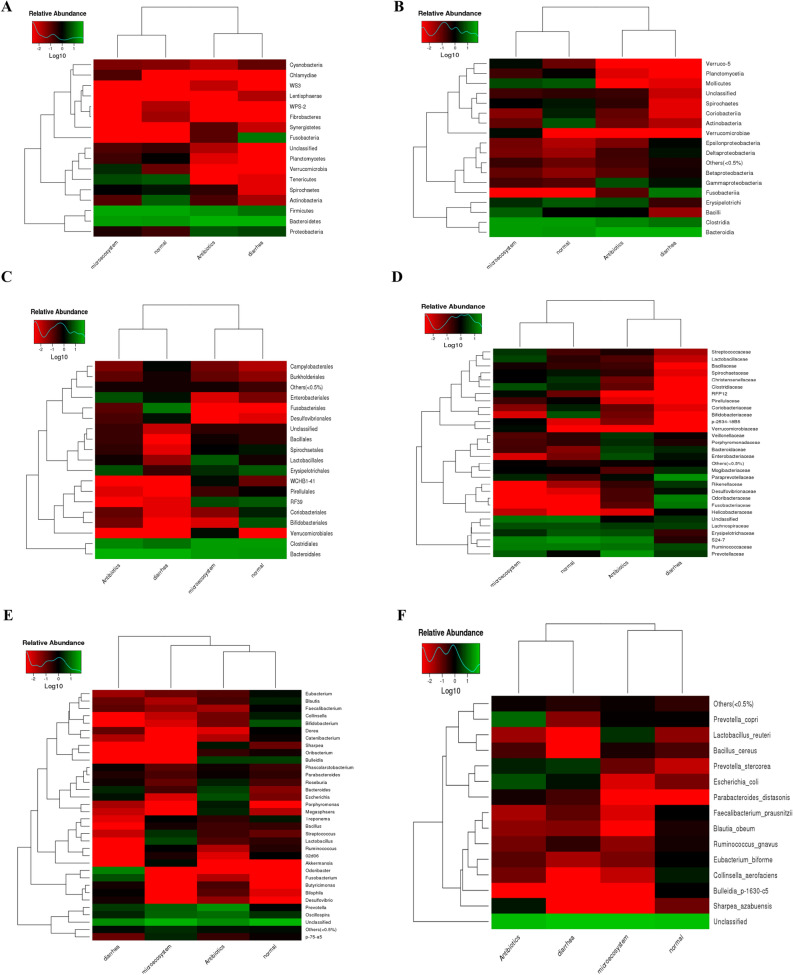
Figure 4.
Bacterial species clustering based on the abundance of each species (heat map) at different taxonomic rank in piglets samples in relation with ill-diarrhea and curing. Log-scaled percentage heat map of phylum- (A), class- (B), order- (C), family- (D), genus- (E) and species- (F) level. Longitudinal clustering indicates the similarity of all species among the four piglet samples. The horizontal clustering indicates the similarity of certain species among the four samples. The closer the distance is and the shorter the branch length is, the more similar the species composition is between the samples. At phylum, all species were used to draw the heatmap. The species of which abundance is less than 0.5% in all samples were classified into “others” in other ranks. The individual bacterial species are represented as colors (gplots, R(v3.1.1), BGI Co., Ltd).

