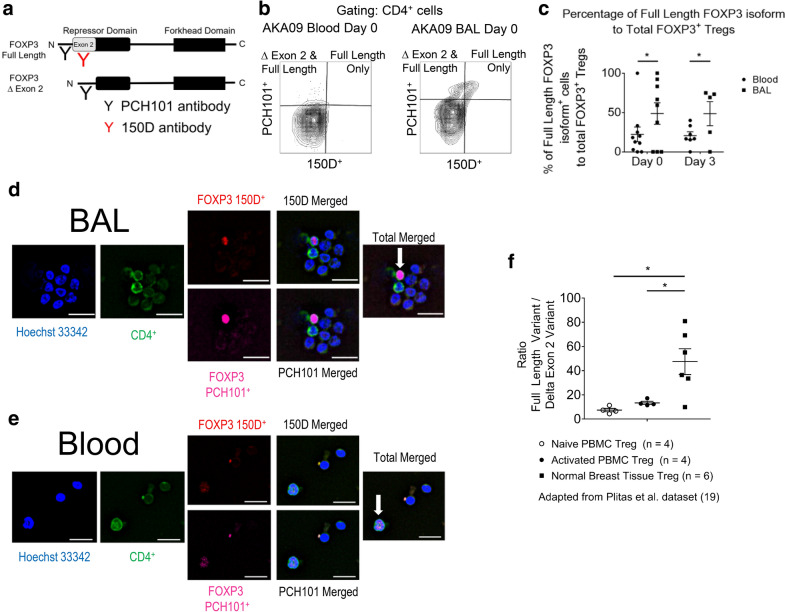
Fig. 2.
FOXP3 mRNA splicing differs in Tregs from the BAL compared to the peripheral blood. a Schematic of two antibody clones that distinguish two of the most common FOXP3 isoforms. Both antibodies (clones PCH101 and 150D) bind to the full-length protein, whereas clone 150D does not bind to the splice variant missing region of FOXP3 coded by exon 2, part of the repressor domain of FOXP3. The regions where two FOXP3 monoclonal antibodies, 150D and PCH101, bind to the FOXP3 protein are illustrated. b Flow cytometric plots and gating schemes used to identify the full length FOXP3 and the splice variant of FOXP3 are illustrated for Tregs in the peripheral blood or BAL using a set of stored blood and BAL cell samples. Gating and dot plot results are representative of at least three independent experiments. c Percentage of full length FOXP3 isoform+ cells to total FOXP3+ Tregs isolated from either the peripheral blood or BAL samples (Day 0: n = 9 lavages, blood n = 10 samples; Day 3: n = 5 lavages, blood n = 7 samples). Data were analyzed using a two way repeated measure ANOVA, with both days and type as repeated factors. The blood results are significantly different from the BAL results on both day 0 and day 3 (P = 0.0245). The data are not different between days. d, e Immunofluorescence of BAL (d) or peripheral blood (e) cytospins prepared from a participant and stained for DNA, CD4+, FOXP3+ clone 150D, and FOXP3+ clone PCH101. Arrows indicate Tregs. White bar: 20 µM. f RNA-Seq data examining two FOXP3 splice variants in a previously reported data set of Tregs isolated from human breast tissue or peripheral blood mononuclear cells (PBMC) [19]. Data expressed as the mean ± SEM. P values for the RNA-Seq data determined by paired and independent t-tests. *P < 0.05

