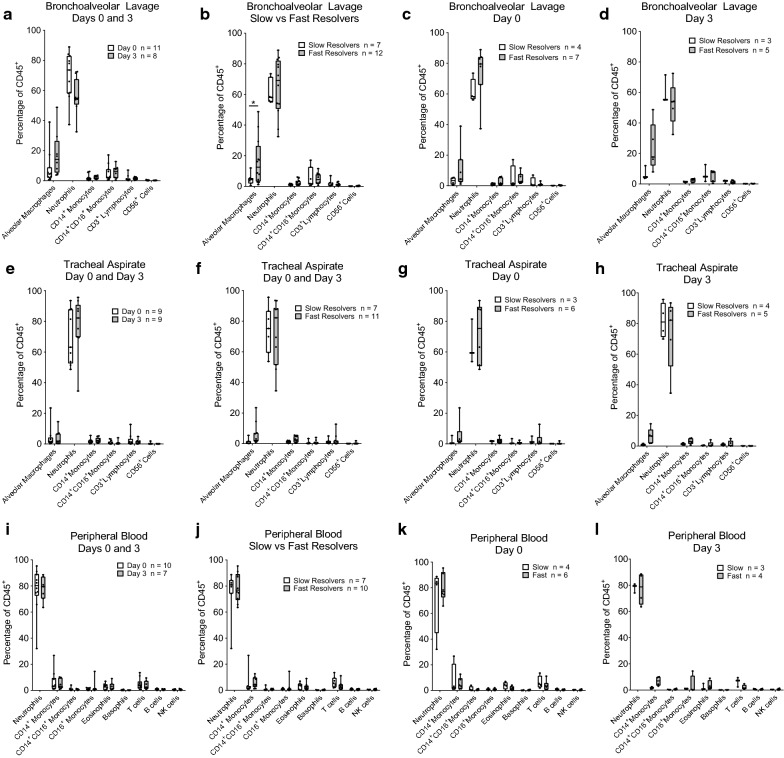
Fig. 3.
Immune cell subsets identified in the bronchoalveolar lavage (BAL), tracheal aspirate, or peripheral blood by flow cytometry. Box-and-Whisker plots showing median, minimum, and maximum with overlay of individual data points (dots) of immune cells, expressed as a percentage of CD45+ cells at day 0 and/or day 3 after enrollment. a–d BAL immune cells expressed as a percentage of CD45+ cells at day 0 or day 3 after enrollment. a Percentages are shown for all participants at both time points. b Fast and slow responders are compared combining data from both days. c Fast and slow responders are compared at Day 0. d Fast and slow responders are compared at Day 3. e–h The tracheal aspirate immune cells expressed as a percentage of CD45+ cells at day 0 or day 3 after enrollment. Percentages are shown for participants at both time points (e), grouped as fast or slow resolvers (f), and categorized as slow or fast resolvers at Day 0 (g) or Day 3 (h). i–l The peripheral blood immune cells expressed as a percentage of CD45+ cells at day 0 or day 3 after enrollment. Percentages are shown for participants at both time points (i), grouped as fast or slow resolvers (j) and categorized as slow or fast resolvers at Day 0 (k) or Day 3 (l). The flow cytometric plots and gating scheme used for the identification of immune cells with gating were adapted from [23]. Data were analyzed per type of cell, without correction of multiple comparisons. For each cell type, repeated measure ANOVA was used to compare day 0 and 3, fast and slow resolvers, and interaction

