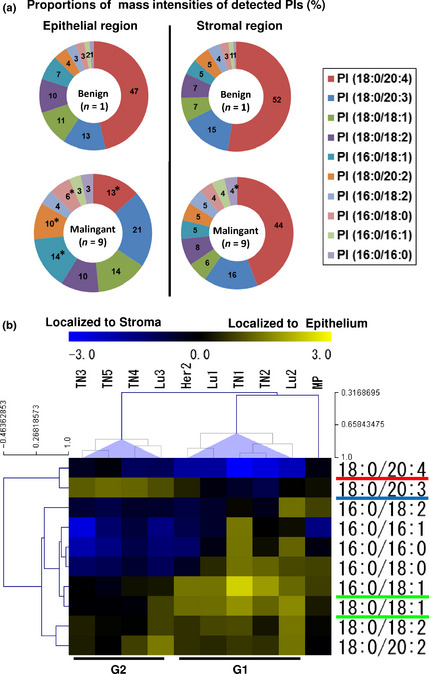
Figure 2.

The distribution of PIs exhibited two distinctive features in breast cancer tissues. (a) Comparison of mass spectrum patterns between benign and malignant mammary glands. Circle graph shows the averaged proportion of each PI among all examined cases (%). The P‐values indicate significant differences from the benign condition. *P < 0.05. (b) Hierarchical clustering of PI distributions. The heat map shows the localization pattern of each PI. The two breast cancer tissue subgroups are identified as G1 and G2.
