Figure 1.

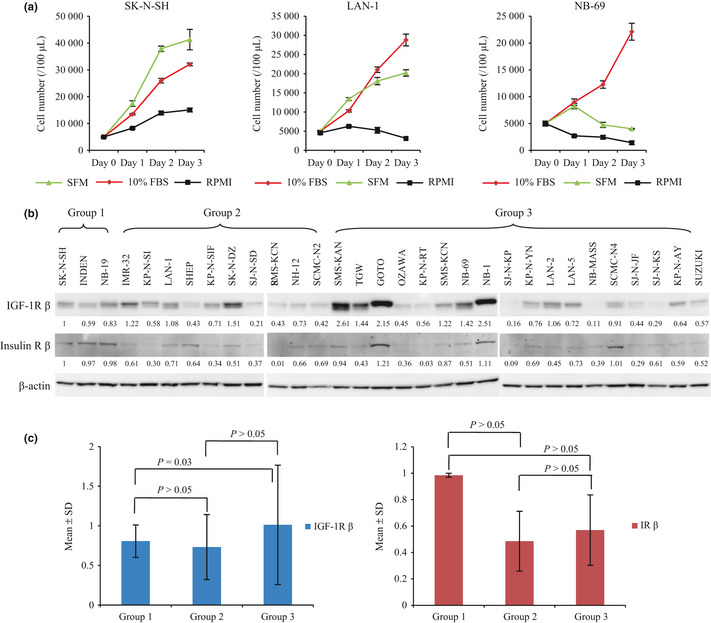
The growth phenotype of the neuroblastoma (NB) cell lines in SFM and RPMI1640 with/without 10% FBS, and the expressions of insulin‐like growth factor 1 receptor (IGF‐1R) and insulin receptor (IR). (a) Three different growth patterns were shown by SK‐N‐SH, LAN‐1 and NB‐69 cell line in SFM and RPMI1640 with/without 10% FBS. (b) Expressions of IGF‐1R and IR in 31 cell lines. Cell lines were cultured in RPMI1640 with 10% FBS, and lysed according to a previous report.31 Target proteins were detected by anti‐IGF‐1R β antibody and anti‐IR β antibody, with β‐actin loaded as a control. Densitometric quantitation of IGF‐1R β and IR β to β‐actin ratio was standardized by the value of the first lane (SK‐N‐SH). (c) Bar graph shows densitometric analysis of the IGF‐1R β and IR β subunit expression displayed according to the NB cell groups. Data are expressed as the mean (±SD) of the values showed in Figure 1b. Statistical analysis was performed using a two‐sided t‐test.
