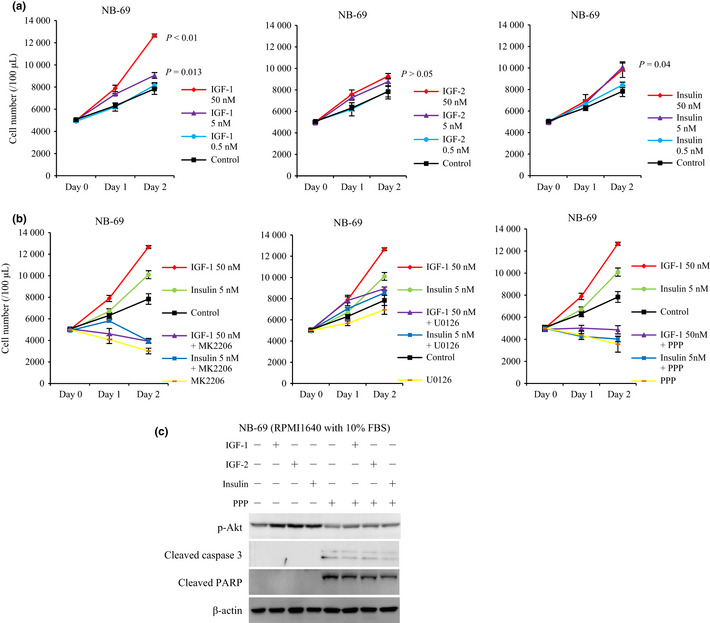
Figure 6.

The effect of exogenous IGF and insulin on NB‐69 cell line in RPMI1640 with 10% FBS. (a) NB‐69 cell line was incubated in RPMI1640 with 10% FBS with/without IGF‐1, IGF‐2, and insulin at the indicated concentrations. Proliferation of the cells was evaluated as cell numbers at the indicated time points. The experiment was repeated three times, and statistical analysis was performed using a two‐sided t‐test, P < 0.01, significant different. (b) NB‐69 cell line subjected to MK2206 (10 μM), U0126 (10 μM) and picropodophyllin (PPP) (2.5 μM) with/without stimulatory ligands: IGF‐1 (50 nM) and insulin (5 nM) in RPMI1640 with 10% FBS. (c) NB‐69 cell line was pre‐incubated with/without PPP (2.5 μM) in RPMI1640 with 10% FBS for 12 h, before 1 h stimulation of IGF‐1 (5 nM), IGF‐2 (5 nM) and insulin (5 nM). Akt phosphorylation, cleaved caspase 3, and cleaved PARP were evaluated by WB. β‐actin was used as a control.
