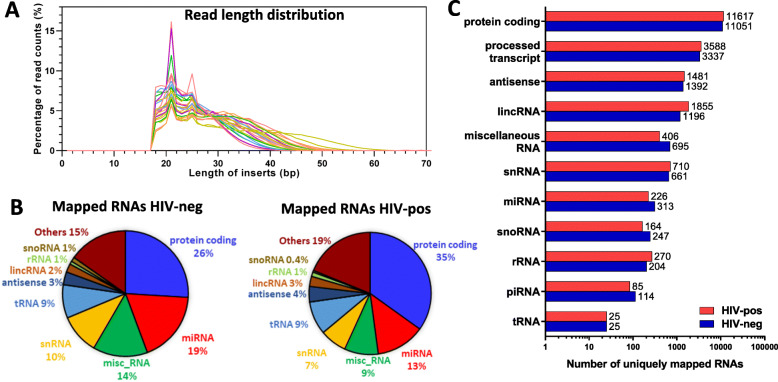
Fig. 3.
Mapping statistics of RNA species detected by small RNA-seq across 24 libraries. a. Size distribution of individual sequencing library inserts. b. Pie charts show distribution of small RNA species in plasma EVs of HIV-negative (left) and HIV-positive (right) subjects. Data shown are means of HIV-negative (n = 12) and HIV-positive (n = 12) subjects and depicted as percentage biotype counts. ‘Others’ category includes 36 additional RNA species listed in Supplementary Table 1. c. Total number of mapped unique RNA references in HIV-positive versus HIV-negative subjects

