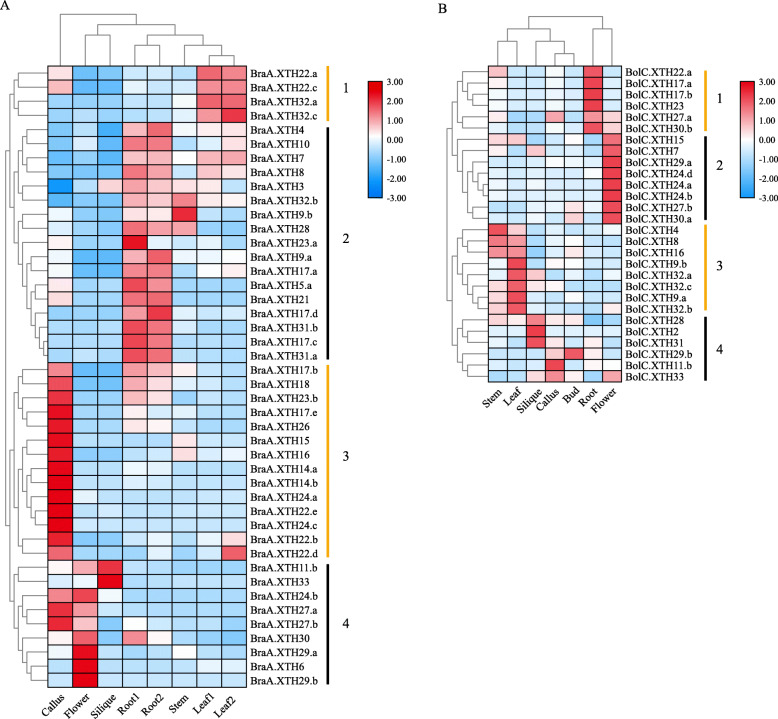
Fig. 5.
Heatmaps of expression clustering for XTH genes across different tissues in B. rapa (a) and B. oleracea (b) based on FPKM values retrieved from the GEO database (http://www.ncbi.nlm.nih.gov/geo/). Two samples of root and leaf tissues were generated from different batches of plants for Fig. 5a. Color scale bars representing relative signal ratios are shown at the top of the right-hand side of each heatmap. Heatmaps were drawn with TBtools. The relative level of expression of a particular gene in each row was normalized against the mean value. Euclidean distance was used to evaluate closeness between genes, and the average linkage method was used for cluster analysis

