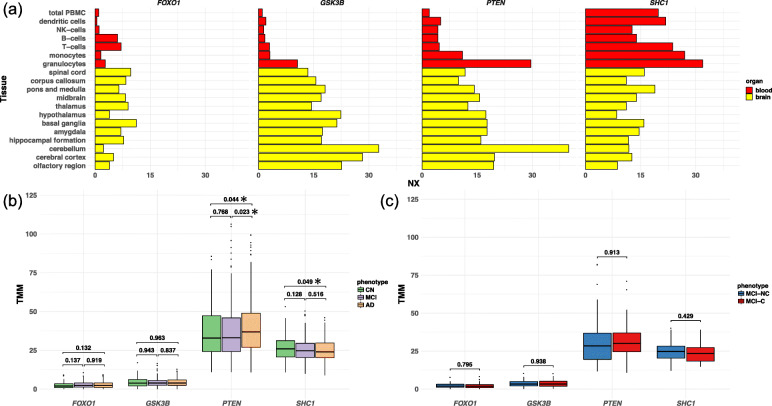
Fig. 5.
Expression of hub genes detected in the PPI network analysis. a The expression of all hub genes in blood cells (red) and brain tissues (yellow) were checked in the Human Protein Atlas database. An X-axis represents the resulting transcript expression values, denoted normalized expression (NX), which were calculated for each gene in every sample. b, c Gene expression was further examined using our 610 blood samples (271 from patients with AD, 248 from patients with MCI, and 91 from CNs). The difference in gene expression was examined between diseases (b) and between MCI-C and MCI-NC patients (n = 123; 48 MCI-C and 75 MCI-NC) (c). b, c P values are displayed above the boxplots. *Statistically significant differences, “exactTest” function in edgeR; TMM, trimmed mean of M values

