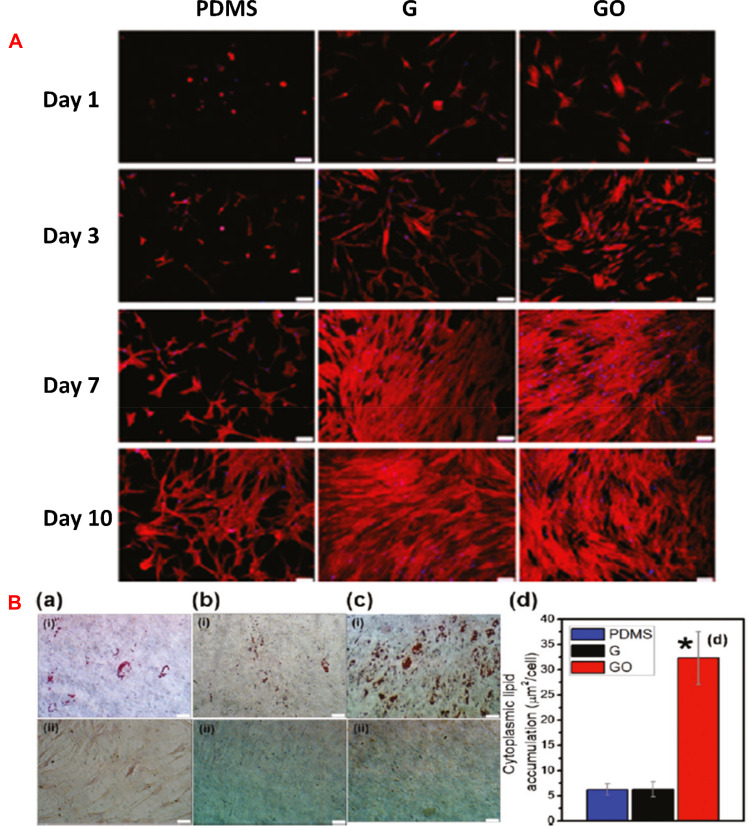
Figure 4.
(A) Fluorescent images of rhodamine-phalloidin stained actin cytoskeleton of MSCs cultured on PDMS, G, and GO at day 1, 3, 7, and 10. Scale bars of the images are 100 μm. Reprinted with permission from Lee WC, Lim CH, Shi H, et al. Origin of enhanced stem cell growth and differentiation on graphene and graphene oxide. ACS Nano. 2011;5(9):7334-41. Copyright 2011 American Chemical Society.52 (B) Oil Red O staining to assess cytoplasmic lipid accumulation after 14 days of (i) with and (ii) without induction on (a) PDMS, (b) G, (c) GO. Scale bars are of 50 μm. (d) Significantly larger amount of fat accumulation for the MSCs differentiated on GO indicated higher susceptibility for adipogenic differentiation than MSCs differentiated on PDMS (a(i)) and G (b(i))(*p < 0.05; n = 4). No lipid deposition was observed for negative controls without any adipogenic induction agents. Reprinted with permission from Lee WC, Lim CH, Shi H, et al. Origin of enhanced stem cell growth and differentiation on graphene and graphene oxide. ACS Nano. 2011;5(9):7334-7341. Copyright 2011 American Chemical Society.52

