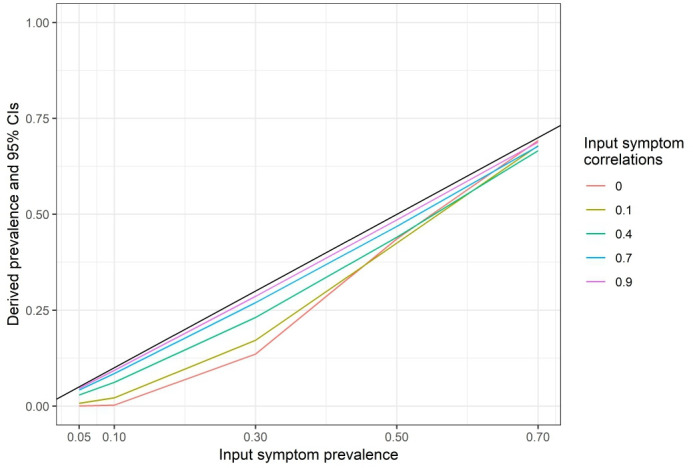
Figure 4.

The prevalence rates of manic episodes by assumed input symptom prevalence and correlations. Manic episodes are diagnosed when the symptoms present as described in the diagnostic manual. The black line represents the situation where the prevalence rates of manic episodes are the same as those of the input symptoms. Lines below the black lines have prevalence rates of manic episodes lower than those of the input symptoms. CI, confidence interval.
