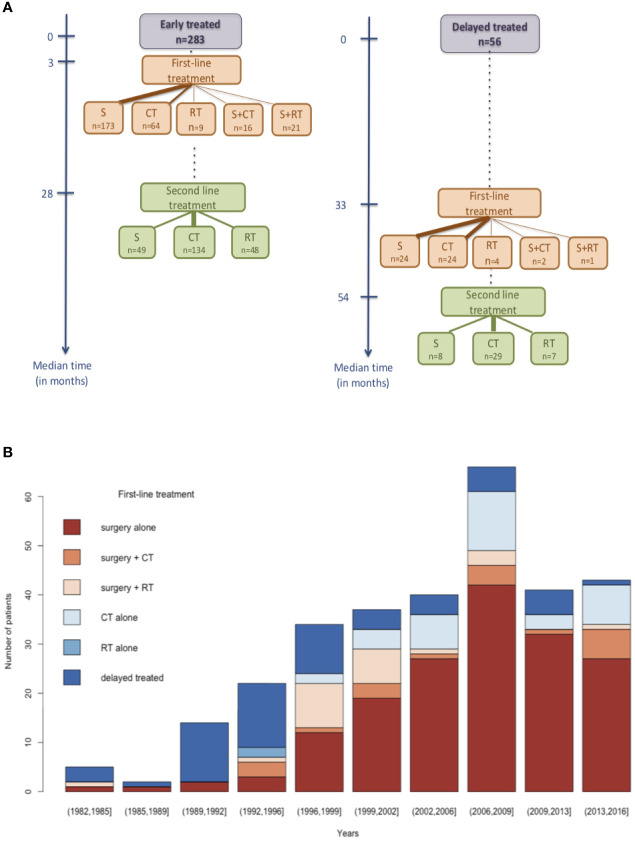
Figure 1.
First-line therapeutic strategy and its evolution over time. (A) The median time delay is presented for both groups: patients who were early treated and delayed treated. The width of the arrows is proportional to the percentage of patients that have received the different treatments. (B) Change of first-line therapeutic strategy over time. S, surgery; CT, chemotherapy; RT, radiotherapy.

