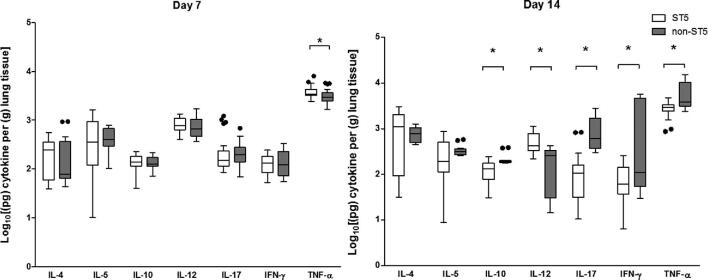
Figure 4.
Genotype-specific cytokine concentrations from lung homogenate of A/J mice at 7 and 14 days postinfection with 5 × 10⁴C. neoformans cells/mouse. Five mice were infected with each strain from each genotype at each time points. ST5 strains induced significantly higher levels of TNF-α at day 7, suggesting an earlier and more profound initial inflammatory response in infected mice. By day 14 mice infected with non-ST5 strains have higher levels proinflammatory cytokines, probably a result of ST5 yeasts being cleared more rapidly from infected mice. The horizontal line within the box indicates the median; boundaries of the box indicate the 25th and 75th percentiles, and the whiskers indicate the highest and lowest values of the results; outliers are denoted as black dots (Tukey method). Data are standardized as picograms of cytokine per gram lung tissue. Asterisks indicate statistically significant differences (Mann-Whitney test).

