Figure 3.

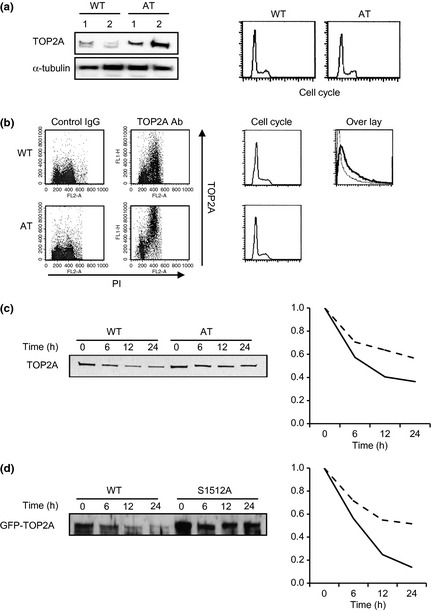
(a) Western blot analysis of wild‐type (WT) cells and ataxia telangiectasia (AT) cells. Right panel, cell cycle distribution analyzed by flow cytometry. (b) Flow cytometric analysis of nuclear topoisomerase II content. Ten thousand cells of the G 2/M population were subjected to analysis. Topoisomerase II alpha (TOP2A) expression (FITC labeling) and cell cycle distribution (propidium iodide [PI] staining) are shown. Cell cycle histograms corresponding to each dot blot are shown (middle panel). Far right, overlaid histograms of TOP2A expression in WT (fine line) and AT (bold line) cells. (c) Half‐life of TOP2A was evaluated in GM0637 and GM05849C cells. Cells were treated for cycloheximine (1 μg/mL) for the indicated time period, and harvested. The TOP2A expression was determined using Western blotting. Right panel, quantitative analysis of TOP2A expression. (d) Half‐life of TOP2A WT and Ser1512Ala mutant transfected in 293T cell, evaluated in the same way as (c).
