
Figure 2.
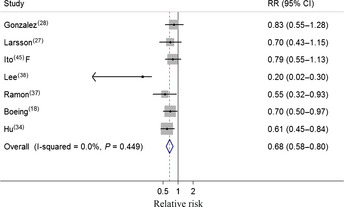
Forest plot (fixed effect model) of cabbage consumption and gastric cancer risk . Squares indicate study‐specific relative risks (RR) (size of the square reflects the study‐specific statistical weight); horizontal lines indicate 95% confidence interval (CI); diamond indicates the summary RR estimate with its 95% CI. F, females.