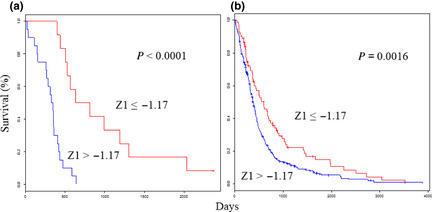
Figure 1.

Survival analyses using the selected 25‐gene classifiers show the prognostic value for glioblastoma. Kaplan–Meier curves that compare groups classified using the Z 1 prognosis prediction score with the 25‐gene model in the test (a) and validation (b) sets.
