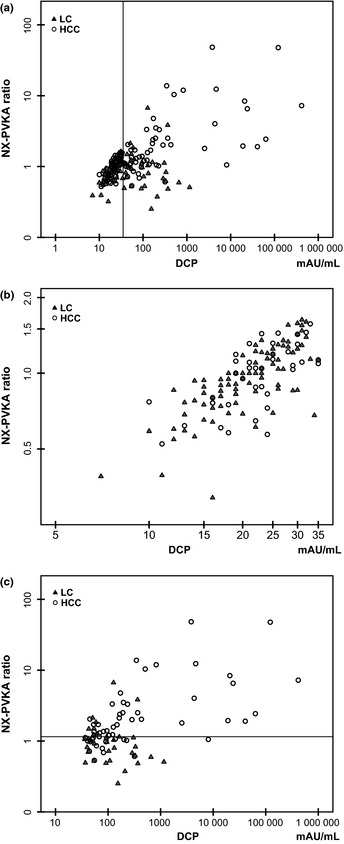
Figure 2.

Scatter diagram of des‐γ‐carboxy prothrombin (DCP; X axis) and NX‐PVKA ratio (Y axis). (a) All cases who were not taking warfarin. The additional vertical line indicates DCP value of 35 mAU/mL. (b) Cases with DCP ≤ 35 mAU/mL. (c) Cases with DCP > 35 mAU/mL. The additional horizontal line indicates NX‐PVKA ratio of 1.15. Open circles indicate hepatocellular carcinoma (HCC) patients and closed triangles indicate liver cirrhosis (LC) patients in each panel.
