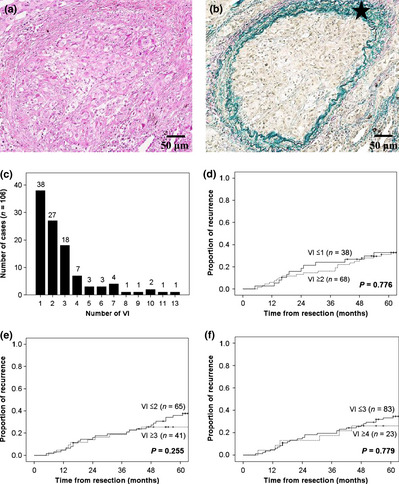
Figure 2.

(a,b) Representative images showing vascular invasion (VI) in lung adenocarcinoma patients. Sections were stained using H&E (a) and Victoria blue van Gieson (b). The star indicates elastic fibers with positive Victoria blue van Gieson staining. (c) Distribution of cases with VI according to the frequency of VI on the maximum cut surface. (d–f) Kaplan–Meier analyses of recurrence according to a VI cut‐off level of 1 (d), 2 (e), and 3 (f).
