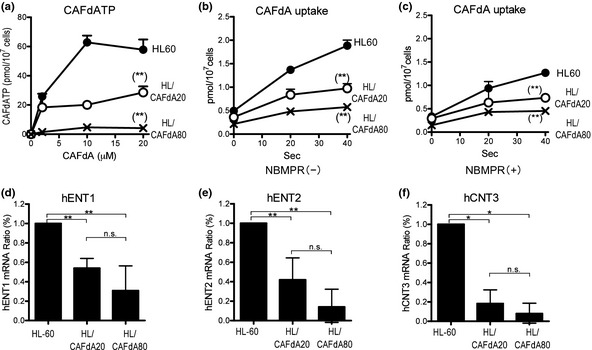
Figure 1.

(a) Measurement of intracellular CAFdATP. The cells were incubated for 4 h with different concentrations (0, 2, 10 and 20 μM) of CAFdA, followed by quantification of CAFdATP using HPLC. (b,c) Cellular uptake of tritiated CAFdA. The capacity of the transporters was determined as the initial drug uptake. The cells were pulsed with tritiated CAFdA for 0, 20 and 40 s in the absence of nitrobenzylmercaptopurine ribonucleoside (NBMPR) (b) and in the presence of NBMPR (c). The experiments were performed at least three times in each cell line. (d–f) Cellular uptake of CAFdA. mRNA expression of human equilibrative nucleoside transporters (hENT) 1, hENT2 and hCNT3 in HL‐60 cells and the resistant variants determined using quantitative RT‐PCR. The data shown are the mean and SD of at least three independent experiments. *P ≤ 0.05; **P ≤ 0.01.
