
Figure 2.
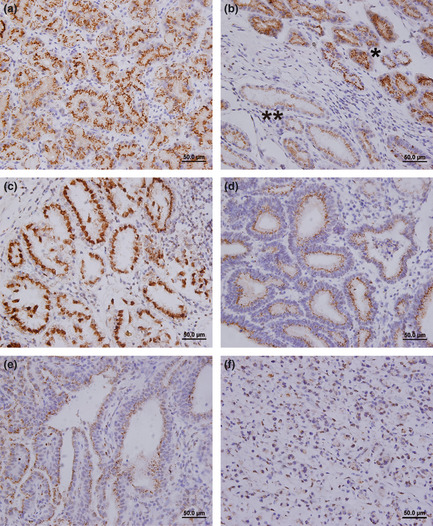
Representative photomicrographs of β1, 6‐N‐acetylglucosaminyltransferase V (MGAT5) expression in sections of gastric cancer and non‐tumor tissues. (a) Non‐tumor tissue shows strong expression of MGAT5. (b) Gastric cancer and adjacent peritumoral tissues. *Gastric peritumoral epithelial cells with strong expression of MGAT5. **Gastric cancer tissue with moderate MGAT5 expression. (c) TNM stage I, strong MGAT5 expression. (d) TNM stage II, moderate MGAT5 expression. (e) TNM stage III, moderate to weak MGAT5 expression. (f) TNM stage IV, weak MGAT5 expression. Scale bar = 50.0 μm.