
Figure 3.
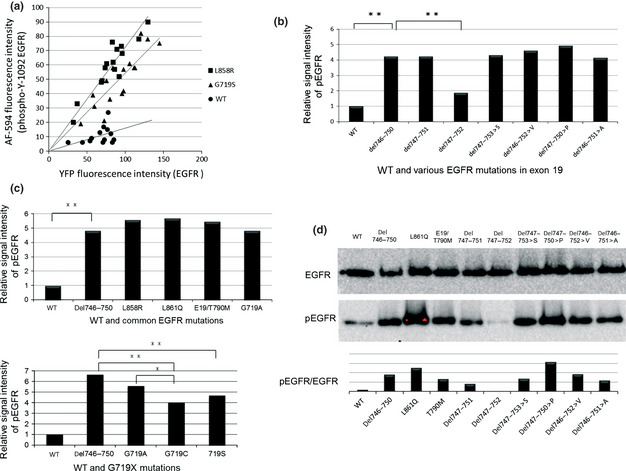
Relative kinase activity of EGFR exon 19 mutations. (a) Semi‐quantitative comparison of YFP‐EGFR‐ICD autophosphorylation levels based on computer‐assisted image analyses. The intensity of YFP and AF‐594 for each cell line was plotted on a scatter plot and an approximation straight lines as obtained. The angles of inclination were compared on a bar graph for each mutation. (b) Comparison of phosphorylation levels of WT EGFR and EGFR exon 19 mutants. (c) Comparison of phosphorylation levels of WT and common EGFR mutations. The y‐axis indicates the relative phosphorylation levels of EGFR. The phosphorylation of WT EGFR is shown as 1. Statistical analysis was performed as described in the Materials and Methods. (d) EGFR and pEGFR levels of several EGFR mutations were quantified by Western blotting. *P < 0.01. **P < 0.05. A, alanine; AF‐594, Alexa Fluor 594; Del, deletion mutation; E19, exon 19; EGFR, epidermal growth factor receptor; P, proline; pEGFR, phosphorylated epidermal growth factor receptor; S, serine; V, valine; YFP, yellow fluorescent protein; YFP‐EGFR‐ICD, YFP‐tagged fragments of the EGFR intracellular domain.