
Figure 1.
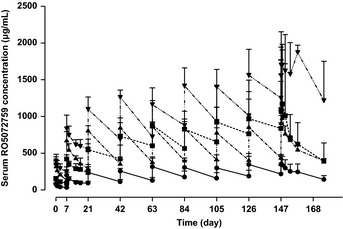
Mean serum GA101 profiles following multiple ascending doses. Three patients per cohort; error bars show standard deviation. Closed circle, cohort 1; closed square, cohort 2; closed triangle, cohort 3; closed point‐down triangle, cohort 4.
Official websites use .gov
A
.gov website belongs to an official
government organization in the United States.
Secure .gov websites use HTTPS
A lock (
) or https:// means you've safely
connected to the .gov website. Share sensitive
information only on official, secure websites.
Mean serum GA101 profiles following multiple ascending doses. Three patients per cohort; error bars show standard deviation. Closed circle, cohort 1; closed square, cohort 2; closed triangle, cohort 3; closed point‐down triangle, cohort 4.