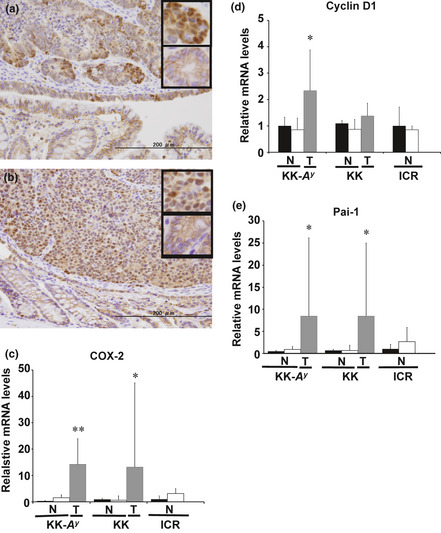
Figure 6.

β‐Catenin activation and relative expression levels of mRNA downstream of β‐catenin signaling. Representative examples of colorectal cancer tissue immunostained with anti‐β‐catenin antibodies (n = 3) of KK‐Ay/TaJcl (KK‐Ay) (a) and KK/TaJcl (KK) (b) mice are shown with enlarged images of β‐catenin staining in the small panels (upper panel, cancerous part; lower panel, non‐cancerous part). Bar = 200 μm. Cyclooxygenase‐2 (COX‐2) (c), cyclin D1 (d), and plasminogen activator inhibitor‐1 (Pai‐1) (e) mRNA in non‐cancerous (N) and cancerous (T) parts of colorectum at 25 weeks were examined by RT‐PCR. Data from the mucosa of the saline‐treated group were set as 1. β‐Actin mRNA was used to normalize the data. ■, Mucosa from the saline‐treated group (n = 3); □, mucosa from azoxymethane‐treated group (n = 2–4);  , cancerous part (n = 5–6). Data are mean ± SD. *P < 0.05, **P < 0.01 vs mucosa from saline‐treated group. KK‐Ay, KK‐Ay/TaJcl; KK, KK/TaJcl.
