
Figure 8.
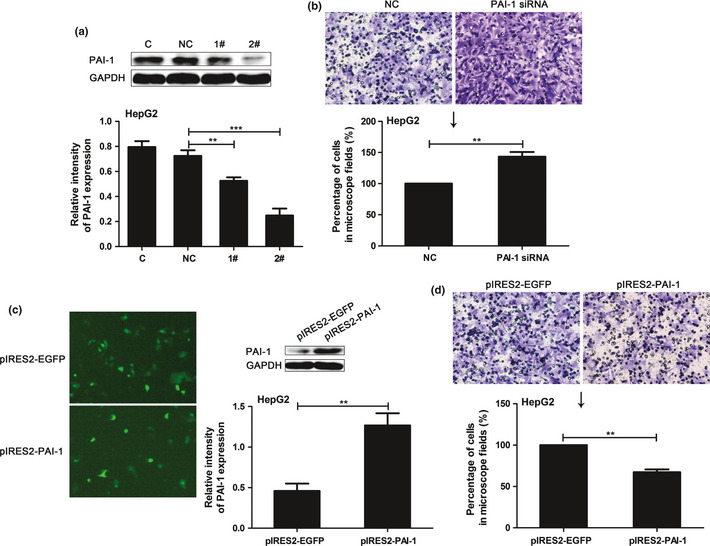
Effect of plasminogen activator inhibitor‐1 (PAI‐1) knockdown or overexpression on hepatocellular carcinoma (HCC) cell invasion. (a) Western blot evaluated the effect of PAI‐1 siRNA. Effect of PAI‐1 knockdown (b) or overexpression (d) on HepG2 cell invasion. (c) Detection of PAI‐1 overexpression, about 65% of the total cells expressed the fluorescence. Figures showing quantitative analysis include data from at least three independent experiments. Values are expressed as mean ± standard deviation (SD). 1#, PAI‐1 siRNA1; 2#, PAI‐1 siRNA2; NC of siRNA group, scramble siRNA; NC of overexpression group, empty pIRES2‐EGFP plasmid. **P < 0.01; ***P < 0.001.