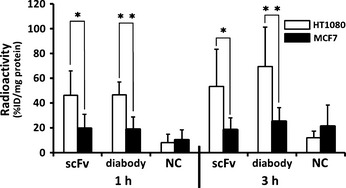
Figure 2.

The radioactivity of HT1080 cells and MCF‐7 cells after incubation for 1 and 3 h with 111In‐MT1‐scFv (scFv), 111In‐MT1‐diabody (diabody) and 111In‐NC‐scFv (NC). Data are expressed as radioactivity per cell protein (mg) (mean ± standard deviation [SD]). Comparison between HT1080 and MCF‐7 cell groups was performed with the Mann–Whitney U‐test (*P < 0.005, **P < 0.0001 versus MCF‐7).
