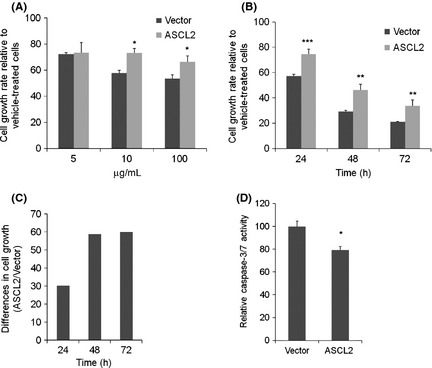
Figure 4.

The effect of ASCL2 on resistance to 5‐fluorouracil. (A) MKN‐1 cells were seeded in 96‐well plates, and the cell growth of MKN‐1 cells were analyzed by CCK‐8 reagent after 24 h exposure to the indicated doses of 5‐fluorouracil. (B) Cell growth of MKN‐1 cells were measured at 24, 48 and 72 h after exposure to 5‐fluorouracil (10 μg/mL). (C) Differences (ASCL2 divided by Vector) in cell growth in panel B. (D) A plot of caspase‐3/7 activity normalized to protein concentration in MKN‐1 cells after 48 h exposure to 5‐fluorouracil (10 μg/mL). Columns, results of triplicate experiments; error bars, SD. *P < 0.05, **P < 0.01, ***P < 0.001.
