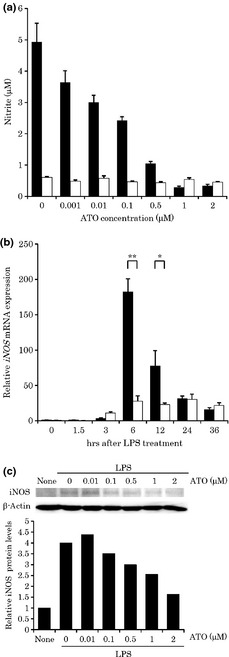
Figure 1.

The effects of arsenic trioxide (ATO) treatment on nitric oxide (NO) production (a), inducible nitric oxide synthase (iNOS) mRNA expression (b), dose‐dependent inhibitory effect of ATO on iNOS protein expression (c) in lipopolysaccharide (LPS)‐stimulated RAW cells. (a) RAW cells were treated with ATO (1 μM) for 90 min, and then stimulated with (black bar) or without (white bar) LPS (100 ng mL−1) for 24 h in the presence of ATO (1 μM). The NO concentrations were measured using the Griess reaction (n = 6). (b) Expression of iNOS mRNA was examined using real‐time polymerase chain reaction (PCR). RAW cells were stimulated with LPS (100 ng mL−1) for the indicated times in the presence of ATO (1 μM). The relative iNOS mRNA expression level with the ATO treatment (white bar) compared to that without the treatment (black bar) is shown after normalization to glyceraldehyde 3‐phosphate dehydrogenase (GAPDH) mRNA expression. Data are expressed relative to the mRNA levels found in the control (at 0 h after LPS stimulation), which was arbitrarily defined as 1. An asterisk (**) or (*) indicates a significant difference with P‐value of less than 0.005 or 0.05, respectively (n = 3). (c) RAW cells were stimulated with LPS (100 ng mL−1) in the presence of various concentrations (0, 0.01, 0.1, 0.5, 1, and 2 μM) of ATO. Ten micrograms of the protein was prepared from RAW cells to detect the iNOS. After normalization to β‐actin protein, data were expressed relatively to the protein levels found in the untreated cells, which were arbitrarily defined as 1.
