
Figure 3.
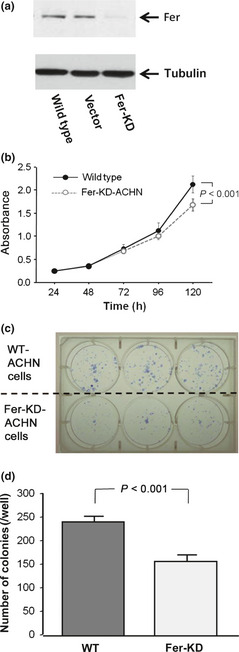
(a) Immunoblotting analysis of feline sarcoma‐related protein (Fer) expression in lentiviral shRNA transduced knockdown (KD) cells relative to untransduced wild‐type (WT) or vector control transduced (VC) ACHN renal cell carcinoma cells. (b) Growth curves of WT‐ and KD‐ACHN cells. Absorbance was measured four times in each cell. (c) Colony numbers were determined by Giemsa staining and only colonies with more than 50 cells were scored. (d) The number of colonies in KD‐ACHN was lower than in WT‐ACHN.