
Figure 2.
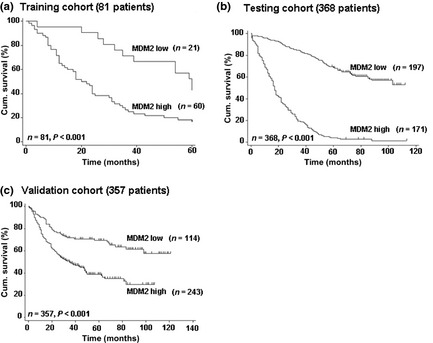
Kaplan–Meier curves depicting overall survival according to expression pattern of MDM2 in three cohorts of gastric cancer patients. P‐values were calculated using the log–rank test. Cum., cumulative.
Official websites use .gov
A
.gov website belongs to an official
government organization in the United States.
Secure .gov websites use HTTPS
A lock (
) or https:// means you've safely
connected to the .gov website. Share sensitive
information only on official, secure websites.
Kaplan–Meier curves depicting overall survival according to expression pattern of MDM2 in three cohorts of gastric cancer patients. P‐values were calculated using the log–rank test. Cum., cumulative.