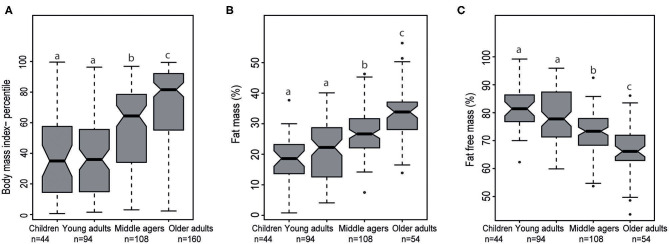
Figure 3.
Notched Box plots of (A) body mass index percentile in the four stages of life, (B) fat mass (%), and (C) fat free mass (%) analyzed by air displacement plethysmography. Middle agers fulfilled our criteria for “cardiometabolic risk” were not taken into account. The effect of different age groups was analyzed with a one-way ANOVA test for normally distributed data and a Kruskal-Wallis test in case of non-normal data. In each case a post-hoc test was performed to analyze all pairwise comparisons. The post-hoc tests were done with an appropriate adjustment for multiple testing. Labeled means in a row without a common superscript letter differ, P < 0.05.

