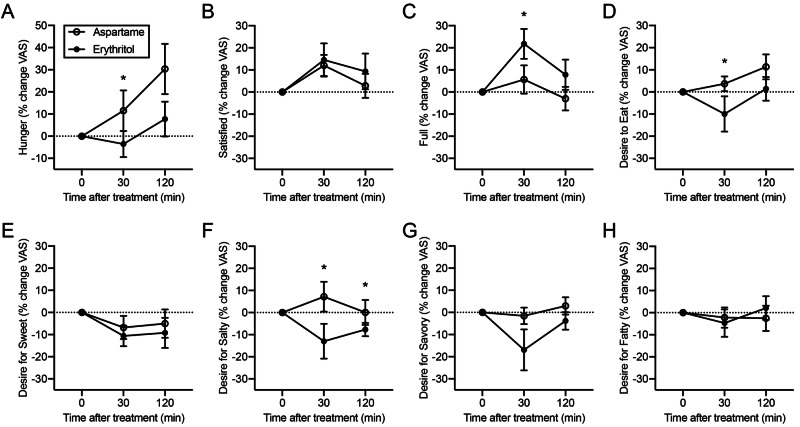
Figure 3. Changes in hunger ratings relative to baseline following consumption of erythritol or aspartame beverages.
Significant differences between the beverage groups are seen at the 30-minute time point for (A) hunger, (C) fullness, (D) desire to eat, and (F) desire for salty foods. No differences between the groups were seen for (B) satisfaction, (E) desire for sweet foods, (G) desire for savory foods, or (H) desire for fatty foods.
Dotted lines indicate baseline values. Error bars represent the standard error of the mean. *=p<0.05.

