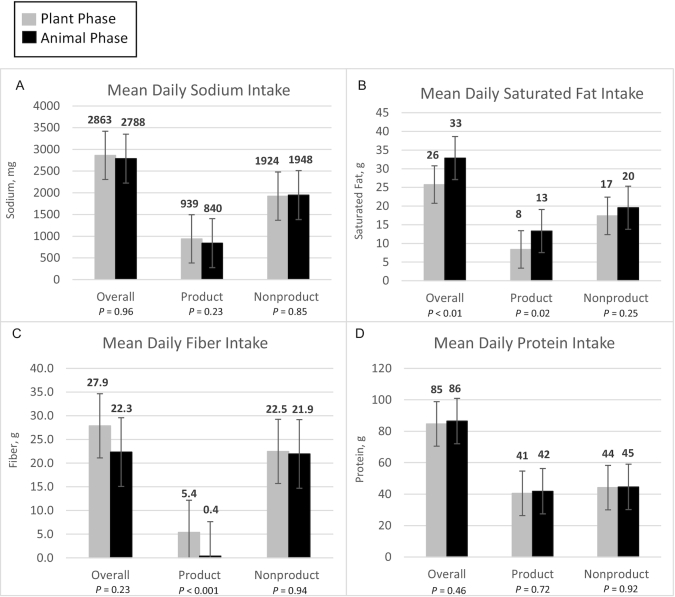
FIGURE 2.
Nutrient data for means of sodium (A), saturated fat (B), fiber (C), and protein (D) consumed daily between the 2 diet phases (n = 36). Product indicates the nutrients from only Plant or Animal, whereas Nonproduct indicates the nutrients from all other sources. Together they add up to the overall amounts of nutrients. Paired t tests were conducted for energy intake and each nutrient to assess for any differences between the Plant and Animal phases. Data are based on estimates determined using NDS-R. Animal, animal meat; NDS-R, Nutrition Data System for Research; Plant, plant-based alternative meat.

